


Ending these programs will mechanically throw the majority of people receiving benefits off UI rolls. What’s the real cost in human terms? The evidence reports an increase in self-reported hardship in paying for regular expenses.
By: Arindrajit Dube
So far, 25 states have ended their participation in all or most of the pandemic unemployment insurance (UI) programs: 22 of these states ended them in June, and 3 in July. All of these 25 states have ended the $300/week benefit boost (Pandemic Unemployment Compensation, or PUC). But 21 out of these 25 states have also ended their participation in the Pandemic Emergency Unemployment Compensation (PEUC) that allow workers to collect unemployment benefits past the roughly 26 weeks that most states offer; and in the Pandemic Unemployment Assistance (PUA) program that offers benefits to those who are ineligible to receive standard UI due to insufficient earnings, being freelancers or gig workers, or other reasons. This is relevant because around 3/4 of workers receiving UI right now are receiving it through PEUC and PUA.
So ending these programs will mechanically throw the majority of people receiving benefits off UI rolls , which is distinct from any debate about behavioral response to the $300/week PUC which has animated much of the discussion when it comes to the topic.
Proponents of cutting off pandemic UI argue that jobs are plentiful, so if pushed out of UI rolls, unemployed workers will quickly find jobs. And as the argument goes, this is especially true in the 25 states cutting off UI, since unemployment rates are lower there than in states keeping the pandemic UI for now.
So what has been the impact so far on the labor market? How have the policy changes impacted the number of people receiving UI benefits? And have these policy changes boosted jobs in those states so far?
Here I use recent data from the Household Pulse Survey (HPS) collected by the Census Bureau to assess the short term impacts of the June expiration. Specifically, the HPS asks whether the respondent received UI in the last 7 days, which allows us to assess the impact of the policy expiration on recipiency. In addition, the HPS also asks whether the respondent is currently working, which allows us to evaluate the employment impacts. The most recent data goes through July 5, 2021. For more information on the HPS, see here.
I group states by their dates of expiration: 4 states ended the programs on June 12, then 8 more states ended them on June 19, and finally 10 additional states ended participation on June 26. The figure below plots the share of population between 18 and 65 years of age that were receiving UI over time by the four groups of states.
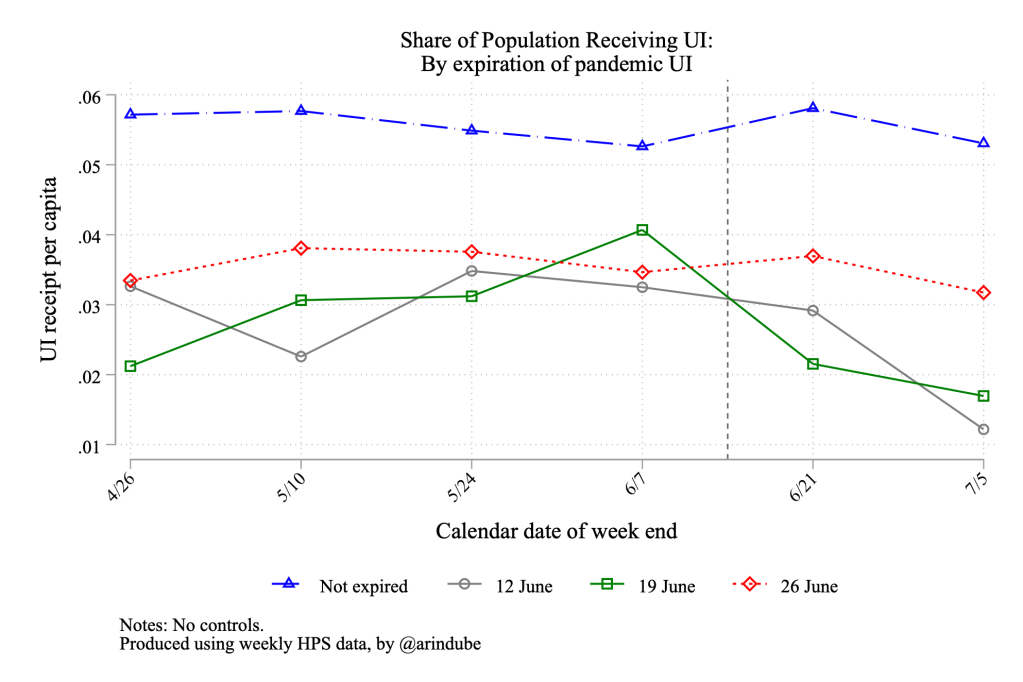
We see that in the 12 states where pandemic UI expired on June 12 (grey) or 19 (green), the share of population receiving UI fell sharply between early June and early July, with a drop of around 2.2 percentage points. The difference-in-differences estimate using the non-expiring states as a control group is 2.3 pp (standard error of 0.6 pp).This amounts to a roughly 60 percent reduction in the UI rolls in these states. UI receipt in states with a June 26 expiration (red) fell only modestly as of early July, but that probably reflects some delay between when the programs end and when people receive their last checks. Finally, the share of population receiving UI remained largely unchanged in states where pandemic UI did not expire in June (blue).
What happened to those who stopped receiving UI in June? Did they transition into work as those advocating ending these programs had predicted?
The next two figures plot the employment to population (EPOP) rates of 18-65 year olds by the same cohorts of states. The first figure plots over the same time horizon as the unemployment receipts and focuses around the June expiration events.
Between early June and early July, the EPOP rates in the states seeing large drops in UI receipt (i.e., 12th and 19th June cohorts in grey and green) saw no uptick in employment. Recall that around 2.2 percent of all 18-65 year olds stopped receiving unemployment benefits between early June and July in these 12 states. At the same time, EPOP in these states declined by around 1.4 percentage points over the same period (while it rose by 0.2 percentage points in states that did not end pandemic UI in June). The difference-in-difference estimate was -1.7 pp (std error of 1.3pp): the 95 percent confidence intervals rule out EPOP rises of 1 pp or more, which is substantially smaller than the 2.2 pp drop in UI receipt. Certainly there was no immediate boost to employment during the 2-3 weeks following the expiration of the pandemic UI benefits.


The second figure zooms out to provide more information about how employment in these four groups of states have evolved over the pandemic. Generally speaking, the early ending states (especially June 12 and 19 cohorts) had higher EPOP rates during 2020, but those gaps had narrowed by early 2021. While a more refined analysis that more closely controls for the evolution of EPOP by expiration groups can be useful, at least over the past few months prior to the expiration, the EPOP in these groups of states seem to have been close in terms of levels and trends.
Did the reduction in UI generosity–both from to individuals losing access to UI programs outright, and for those receiving claims but losing the $300 PUC–lead to greater financial hardship?
The HPS asks respondents if in the last 7 days, it’s even difficult to pay for usual household expenses. I define people as stating they are experiencing difficulty with paying for expenses if they say it has been either “somewhat difficult” or “very difficult” in response to this question. The figure below shows an increase in respondents reporting difficulty in paying for expenses following the expiration in the states expiring in June. The difference in difference estimate for the June 12 and 19 cohorts is around 3.7 pp (standard error = 1.9 pp) and this is statistically significant at conventional levels. The fact that more people report hardships than losing UI benefits eligibility makes sense, as even those who remain eligible experience a sizable $300/week cut in benefit level. The overall effect sizes is consistent with how many people lose UI benefits either through eligibility or level of benefits.

Overall, the mid-June expirations of pandemic UI seem to have sharply reduced the share of population receiving any unemployment benefits. But this doesn’t seem to have translated into most of these individuals having jobs in the first 2-3 weeks following expiration. However, there is evidence that the reduced UI benefits increased self-reported hardship in paying for regular expenses. Of course, this evidence is still early, and more data is needed to paint a fuller picture.