


The median worker should be making as much as $102,000 annually—if some $2.5 trillion wasn’t being “reverse distributed” every year away from the working class.
Just how far has the working class been left behind by the winner-take-all economy? A new analysis by the RAND Corporation examines what rising inequality has cost Americans in lost income—and the results are stunning.
A full-time worker whose taxable income is at the median—with half the population making more and half making less—now pulls in about $50,000 a year.
Yet had the fruits of the nation’s economic output been shared over the past 45 years as broadly as they were from the end of World War II until the early 1970s, that worker would instead be making $92,000 to $102,000. (The exact figures vary slightly depending on how inflation is calculated.)
The findings, which land amid a global pandemic, help to illuminate the paradoxes of an economy in which so-called essential workers are struggling to make ends meet while the rich keep getting richer.
“We were shocked by the numbers,” says Nick Hanauer, a venture capitalist who came up with the idea for the research along with David Rolf, founder of Local 775 of the Service Employees International Union and president of the Fair Work Center in Seattle. “It explains almost everything. It explains why people are so pissed off. It explains why they are so economically precarious.”
“THE $2.5 TRILLION THEFT”
Notably, it isn’t just those in the middle who’ve been hit. RAND found that full-time, prime-age workers in the 25th percentile of the U.S. income distribution would be making $61,000 instead of $33,000 had everyone’s earnings from 1975 to 2018 expanded roughly in line with gross domestic product, as they did during the 1950s and ’60s.
Workers in the 75th percentile would be at $126,000 instead of $81,000. Remarkably, even those in the 90th percentile would be better off than they are now if economic growth had been shared as it was in the post-war era. They’d be making $168,000 rather than $133,000.
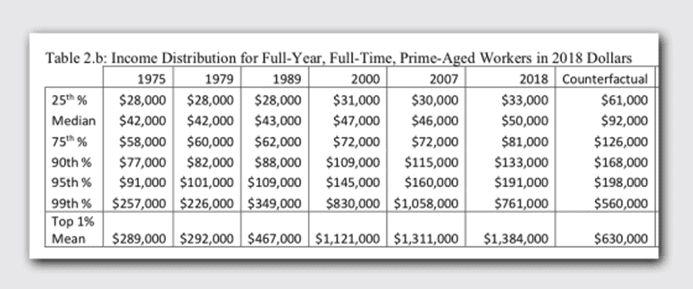
Tally it all up, according to RAND, and the bottom 90% of American workers would be bringing home an additional $2.5 trillion in total annual income if economic gains were as equitably divided as they’d been in the past—leading Rolf to dub the phenomenon “the $2.5 trillion theft.”
“From the standpoint of people who have worked hard and played by the rules and yet are participating far less in economic growth than Americans did a generation ago,” he says, “whether you call it ‘reverse distribution’ or ‘theft,’ it demands to be called something.”
The RAND data also makes clear who the winners from inequality are: those in the top 1%.
Of course, they’d be in a less advantageous position if the economic pie had been divvied up since the mid-1970s like it was previously. If that were the case, RAND says, yearly income for the average one-percenter would fall from about $1.2 million to $549,000.
Although he himself is a self-described “zillionaire,” Hanauer is an outspoken critic of the gulf between the rich and everyone else. He thinks and writes and agitates on these issues all the time. But even he was surprised by RAND’s findings. In fact, he says that before the report was completed, he had done his own “back-of-the-envelope math” and wound up underestimating by a good 40% the degree to which workers’ incomes have failed to keep pace with GDP. “It’s startling,” he says.
“There is no way of slicing the numbers where people come out ahead.”
RAND crunched the data in all sorts of ways, and the basic pattern held true for part-time workers, entire families, men and women, Blacks and whites, urban dwellers and rural residents, and those with high school degrees and those with college diplomas.
“There is no way of slicing the numbers where people come out ahead,” says Carter Price, a senior mathematician at RAND, who co-authored the study with his colleague Kathryn Edwards, an economist. “I was surprised by the magnitude of this.”
Price acknowledges that one weakness in the model is that it doesn’t reflect people’s total compensation, including the value of employer-provided health benefits.
It also does not include monies received from government transfer programs, such as Social Security. It does count rental income, dividends, and interest. And it takes into account capital gains but, due to certain technical constraints, only for those above the 90th percentile. However, because these proceeds from the sale of property or an investment amount to just 2% of income for the bottom 99% of households, the authors say, this wrinkle doesn’t “meaningfully change” any of their conclusions.
Indeed, for the vast majority of Americans, what they earn at work through hourly wages or a salary represents practically all of their income. And that is fully captured in the study.
It was no accident that the Fair Work Center commissioned RAND to look at the impact of inequality. Although a number of organizations conduct rigorous research on the topic, some of them—such as the Economic Policy Institute and the Center for American Progress—are identified as liberal. RAND is generally viewed as being among “the least partisan” shops out there, taken seriously “by the right and the left,” Hanauer notes.
“We wanted to do it in a way that would at least make it harder for the people who want to believe this is all just whining” to dismiss the data, he says.
The approach that Price and Edwards took marks a breakthrough.
The Economic Policy Institute has created a tool that shows that had U.S. workers’ wages over the past three decades kept up with increases in productivity, as they did in the three decades following World War II, someone making around $50,000 today would instead be making more than $70,000.
But until now, nobody has teased out the bottom-line effects to individuals and their families of how economic growth is being shared across the income spectrum, thereby turning what can be an abstract concept into something much more tangible.
“I have not seen anything like this,” says Ben Olinsky, the senior vice president of policy and strategy at the Center for American Progress, who got an advance peek at the RAND study. “It’s quite dramatic.”
WHERE THE BLAME LIES
Price and Edwards didn’t comment on what might be causing inequality, saying that “additional work” is needed in this area. But Hanauer and Rolf had no hesitation singling out culprits.
They say the blame lies, in large measure, with decades of failed federal policy decisions—allowing the minimum wage to deteriorate, overtime coverage to dwindle, and the effectiveness of labor law to decline, undermining union power.
They also cite a shift in corporate culture that has elevated the interests of shareholders over those of workers, an ethos that took root 50 years ago this week with the publication of an essay by University of Chicago economist Milton Friedman.
Many of these developments, Rolf points out, have been driven by the belief that an unfettered free market would generate wealth for everyone. Thanks to the RAND study, he says, “we now have the proof that this theory was wrong.”
As the 2020 election nears, Olinsky says, the report may well make it tougher to pit “the poorest Americans against the middle class,” as some politicians are wont to do, because it crystalizes that everybody outside of the top 1% has not fared well financially when compared with what would have been expected historically.
“This really is the entire country versus a very small number of people,” Olinsky says.
The other seismic political implication of the RAND report is that any modest proposal to democratize prosperity is bound to seem inadequate. Given the gap that the study has brought to light, Rolf says, anything but the boldest of actions will “look like a drop in the ocean.”
Hanauer agrees. “I want Joe Biden and Donald Trump to have to wrestle with this,” he says, adding that they should “look at their constituents in the eye and explain, ‘Here’s what I’m going to do to get you from the $50,000 you make today to the $100,000 you deserve.”
“If you’re not addressing the problem at that scale,” Hanauer asserts, “then you’re not addressing the problem. You’re just pretending.”
_________________________________________________________
ABOUT THE AUTHOR
Rick Wartzman is head of the KH Moon Center for a Functioning Society at the Drucker Institute and the author of four books, including his latest, The End of Loyalty: The Rise and Fall of Good Jobs in America. You can follow him @RWartzman.
This article first appeared in Fast Magazine – https://www.fastcompany.com/90550015/we-were-shocked-rand-study-uncovers-massive-income-shift-to-the-top-1