


Wealth inequality is escalating at an alarming rate not only within the U.S. but also in countries as diverse as Russia, India and Brazil. According to investment bank Credit Suisse, the fraction of global household wealth held by the richest 1 percent of the world’s population increased from 42.5 to 47.2 percent between the financial crisis of 2008 and 2018. To put it another way, as of 2010, 388 individuals possessed as much household wealth as the lower half of the world’s population combined—about 3.5 billion people; today Oxfam estimates that number as 26. Statistics from almost all nations that measure wealth in their household surveys indicate that it is becoming increasingly concentrated.
Although the origins of inequality are hotly debated, an approach developed by physicists and mathematicians, including my group at Tufts University, suggests they have long been hiding in plain sight—in a well-known quirk of arithmetic. This method uses models of wealth distribution collectively known as agent-based, which begin with an individual transaction between two “agents” or actors, each trying to optimize his or her own financial outcome. In the modern world, nothing could seem more fair or natural than two people deciding to exchange goods, agreeing on a price and shaking hands. Indeed, the seeming stability of an economic system arising from this balance of supply and demand among individual actors is regarded as a pinnacle of Enlightenment thinking—to the extent that many people have come to conflate the free market with the notion of freedom itself. Our deceptively simple mathematical models, which are based on voluntary transactions, suggest, however, that it is time for a serious reexamination of this idea.
In particular, the affine wealth model (called thus because of its mathematical properties) can describe wealth distribution among households in diverse developed countries with exquisite precision while revealing a subtle asymmetry that tends to concentrate wealth. We believe that this purely analytical approach, which resembles an x-ray in that it is used not so much to represent the messiness of the real world as to strip it away and reveal the underlying skeleton, provides deep insight into the forces acting to increase poverty and inequality today.
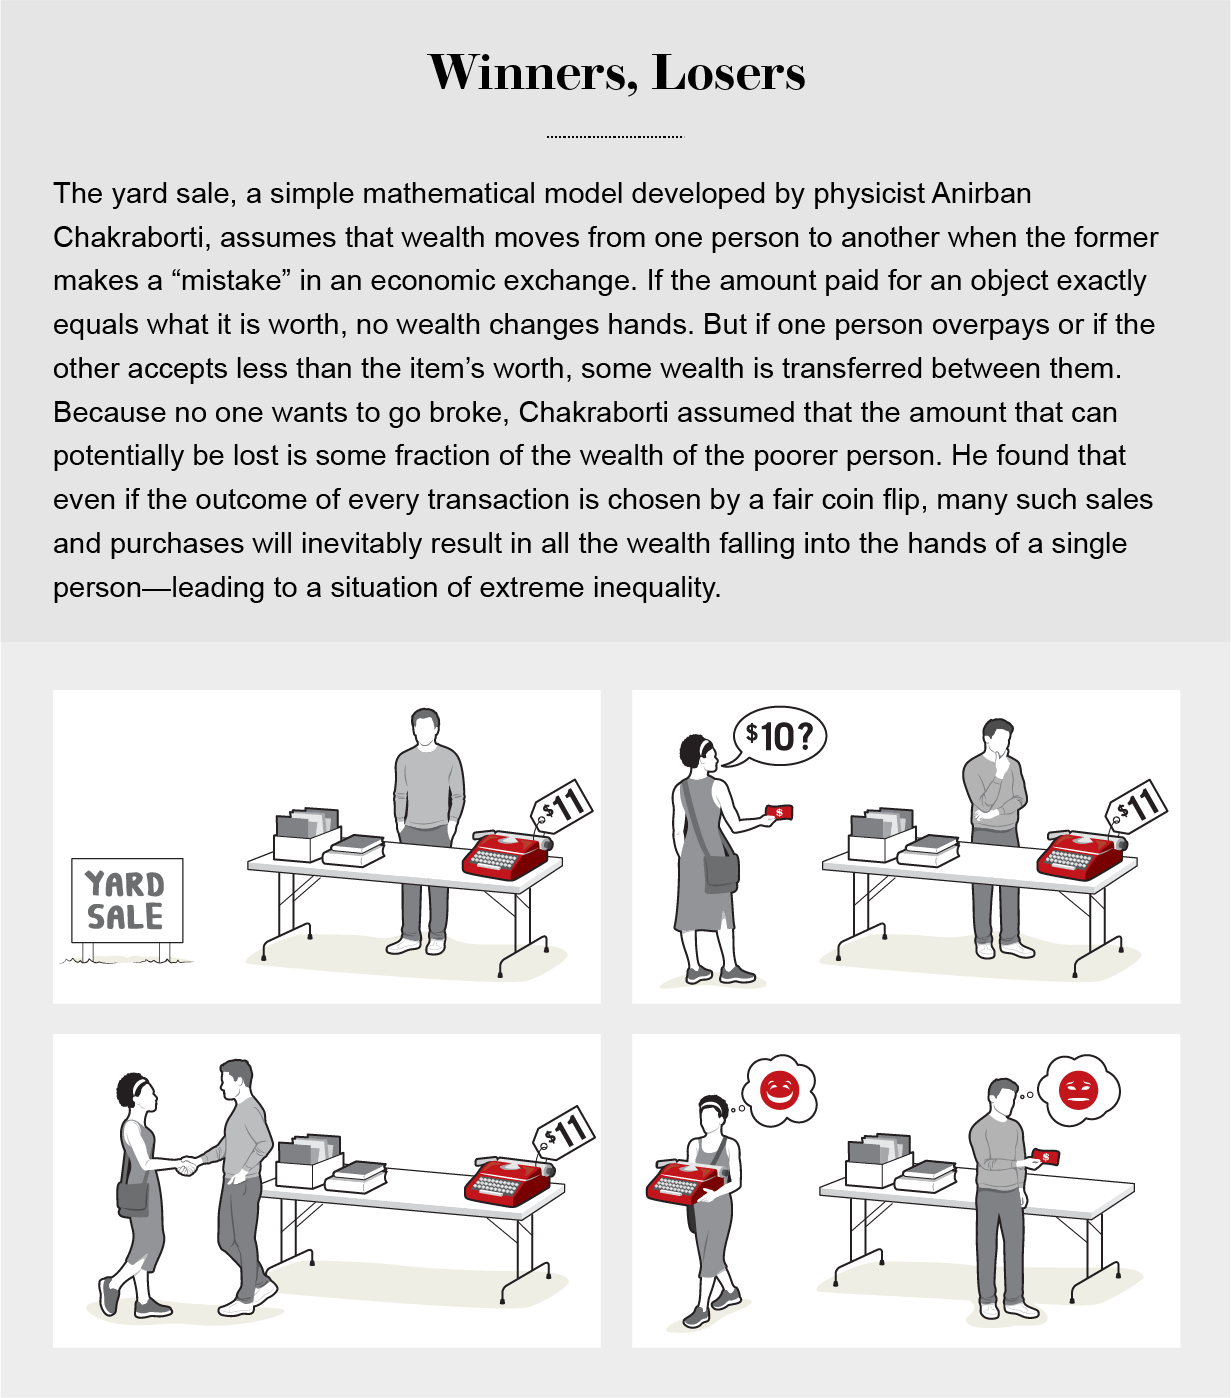
In 1986 social scientist John Angle first described the movement and distribution of wealth as arising from pairwise transactions among a collection of “economic agents,” which could be individuals, households, companies, funds or other entities. By the turn of the century physicists Slava Ispolatov, Pavel L. Krapivsky and Sidney Redner, then all working together at Boston University, as well as Adrian Drgulescu, now at Constellation Energy Group, and Victor Yakovenko of the University of Maryland, had demonstrated that these agent-based models could be analyzed with the tools of statistical physics, leading to rapid advances in our understanding of their behavior. As it turns out, many such models find wealth moving inexorably from one agent to another—even if they are based on fair exchanges between equal actors. In 2002 Anirban Chakraborti, then at the Saha Institute of Nuclear Physics in Kolkata, India, introduced what came to be known as the yard sale model, called thus because it has certain features of real one-on-one economic transactions. He also used numerical simulations to demonstrate that it inexorably concentrated wealth, resulting in oligarchy.
To understand how this happens, suppose you are in a casino and are invited to play a game. You must place some ante—say, $100—on a table, and a fair coin will be flipped. If the coin comes up heads, the house will pay you 20 percent of what you have on the table, resulting in $120 on the table. If the coin comes up tails, the house will take 17 percent of what you have on the table, resulting in $83 left on the table. You can keep your money on the table for as many flips of the coin as you would like (without ever adding to or subtracting from it). Each time you play, you will win 20 percent of what is on the table if the coin comes up heads, and you will lose 17 percent of it if the coin comes up tails. Should you agree to play this game?
You might construct two arguments, both rather persuasive, to help you decide what to do. You may think, “I have a probability of ½ of gaining $20 and a probability of ½ of losing $17. My expected gain is therefore:
½ x ($20) + ½ x (-$17) = $1.50
which is positive. In other words, my odds of winning and losing are even, but my gain if I win will be greater than my loss if I lose.” From this perspective it seems advantageous to play this game.
Or, like a chess player, you might think further: “What if I stay for 10 flips of the coin? A likely outcome is that five of them will come up heads and that the other five will come up tails. Each time heads comes up, my ante is multiplied by 1.2. Each time tails comes up, my ante is multiplied by 0.83. After five wins and five losses in any order, the amount of money remaining on the table will be:
1.2 x 1.2 x 1.2 x 1.2 x 1.2 x 0.83 x 0.83 x 0.83 x 0.83 x 0.83 x $100 = $98.02
so I will have lost about $2 of my original $100 ante.” With a bit more work you can confirm that it would take about 93 wins to compensate for 91 losses. From this perspective it seems disadvantageous to play this game.
The contradiction between the two arguments presented here may seem surprising at first, but it is well known in probability and finance. Its connection with wealth inequality is less familiar, however. To extend the casino metaphor to the movement of wealth in an (exceedingly simplified) economy, let us imagine a system of 1,000 individuals who engage in pairwise exchanges with one another. Let each begin with some initial wealth, which could be exactly equal. Choose two agents at random and have them transact, then do the same with another two, and so on. In other words, this model assumes sequential transactions between randomly chosen pairs of agents. Our plan is to conduct millions or billions of such transactions in our population of 1,000 and see how the wealth ultimately gets distributed.
What should a single transaction between a pair of agents look like? People have a natural aversion to going broke, so we assume that the amount at stake, which we call Δω (Δω is pronounced “delta w”), is a mere fraction of the wealth of the poorer person, Shauna. That way, even if Shauna loses in a transaction with Eric, the richer person, the amount she loses is always less than her own total wealth. This is not an unreasonable assumption and in fact captures a self-imposed limitation that most people instinctively observe in their economic life. To begin with—just because these numbers are familiar to us—let us suppose Δω is 20 percent of Shauna’s wealth, ω, if she wins and –17 percent of ω if she loses. (Our actual model assumes that the win and loss percentages are equal, but the general outcome still holds. Moreover, increasing or decreasing Δω will just extend the time scale so that more transactions will be required before we can see the ultimate result, which will remain unaltered.)
If our goal is to model a fair and stable market economy, we ought to begin by assuming that nobody has an advantage of any kind, so let us decide the direction in which w is moved by the flip of a fair coin. If the coin comes up heads, Shauna gets 20 percent of her wealth from Eric; if the coin comes up tails, she must give 17 percent of it to Eric. Now randomly choose another pair of agents from the total of 1,000 and do it again. In fact, go ahead and do this a million times or a billion times. What happens?
If you simulate this economy, a variant of the yard sale model, you will get a remarkable result: after a large number of transactions, one agent ends up as an “oligarch” holding practically all the wealth of the economy, and the other 999 end up with virtually nothing. It does not matter how much wealth people started with. It does not matter that all the coin flips were absolutely fair. It does not matter that the poorer agent’s expected outcome was positive in each transaction, whereas that of the richer agent was negative. Any single agent in this economy could have become the oligarch—in fact, all had equal odds if they began with equal wealth. In that sense, there was equality of opportunity. But only one of them did become the oligarch, and all the others saw their average wealth decrease toward zero as they conducted more and more transactions. To add insult to injury, the lower someone’s wealth ranking, the faster the decrease.
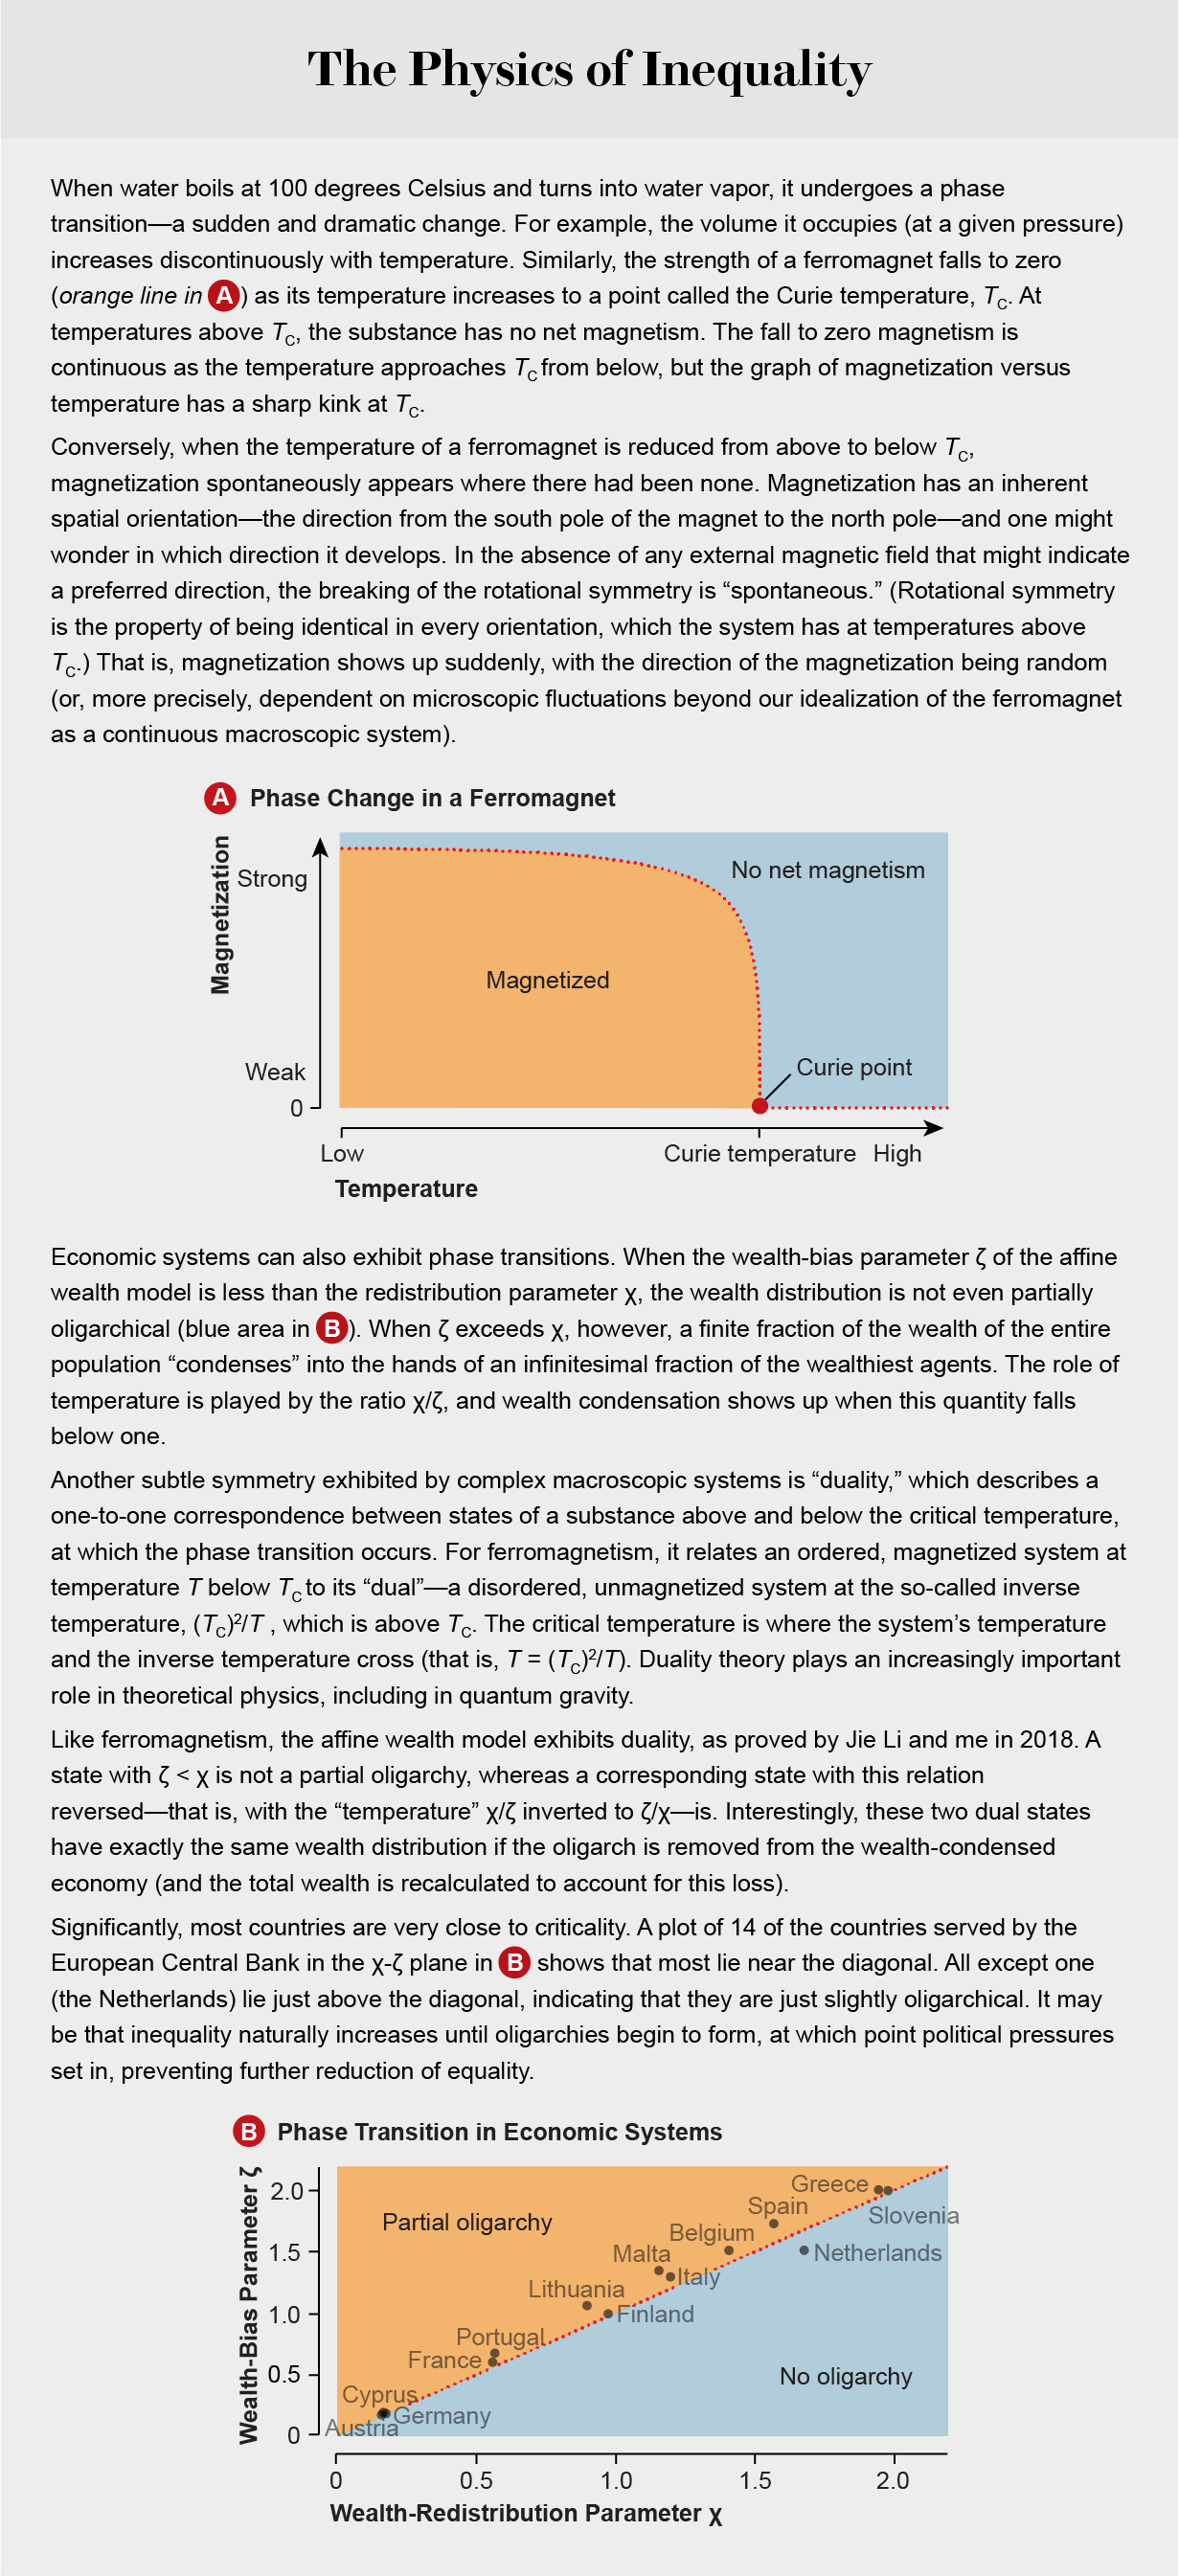
This outcome is especially surprising because it holds even if all the agents started off with identical wealth and were treated symmetrically. Physicists describe phenomena of this kind as “symmetry breaking” [see The Physics of Inequality below]. The very first coin flip transfers money from one agent to another, setting up an imbalance between the two. And once we have some variance in wealth, however minute, succeeding transactions will systematically move a “trickle” of wealth upward from poorer agents to richer ones, amplifying inequality until the system reaches a state of oligarchy.
If the economy is unequal to begin with, the poorest agent’s wealth will probably decrease the fastest. Where does it go? It must go to wealthier agents because there are no poorer agents. Things are not much better for the second-poorest agent. In the long run, all participants in this economy except for the very richest one will see their wealth decay exponentially. In separate papers in 2015 my colleagues and I at Tufts University and Christophe Chorro of Université Panthéon-Sorbonne provided mathematical proofs of the outcome that Chakraborti’s simulations had uncovered—that the yard sale model moves wealth inexorably from one side to the other.
Does this mean that poorer agents never win or that richer agents never lose? Certainly not. Once again, the setup resembles a casino—you win some and you lose some, but the longer you stay in the casino, the more likely you are to lose. The free market is essentially a casino that you can never leave. When the trickle of wealth described earlier, flowing from poor to rich in each transaction, is multiplied by 7.7 billion people in the world conducting countless transactions every year, the trickle becomes a torrent. Inequality inevitably grows more pronounced because of the collective effects of enormous numbers of seemingly innocuous but subtly biased transactions.
THE CONDENSATION OF WEALTH
You might, of course, wonder how this model, even if mathematically accurate, has anything to do with reality. After all, it describes an entirely unstable economy that inevitably degenerates to complete oligarchy, and there are no complete oligarchies in the world. It is true that, by itself, the yard sale model is unable to explain empirical wealth distributions. To address this deficiency, my group has refined it in three ways to make it more realistic.
In 2017 Adrian Devitt-Lee, Merek Johnson, Jie Li, Jeremy Marcq, Hongyan Wang and I, all at Tufts, incorporated the redistribution of wealth. In keeping with the simplicity desirable in applied mathematics models, we did this by having each agent take a step toward the mean wealth in the society after each transaction. The size of the step was some fraction χ (or “chi”) of his or her distance from the mean. This is equivalent to a flat wealth tax for the wealthy (with tax rate χ per unit time) and a complementary subsidy for the poor. In effect, it transfers wealth from those above the mean to those below it. We found that this simple modification stabilized the wealth distribution so that oligarchy no longer resulted. And astonishingly, it enabled our model to match empirical data on U.S. and European wealth distribution between 1989 and 2016 to better than 2 percent. The single parameter χ seems to subsume a host of real-world taxes and subsidies that would be too messy to include separately in a skeletal model such as this one.
In addition, it is well documented that the wealthy enjoy systemic economic advantages such as lower interest rates on loans and better financial advice, whereas the poor suffer systemic economic disadvantages such as payday lenders and a lack of time to shop for the best prices. As James Baldwin once observed, “Anyone who has ever struggled with poverty knows how extremely expensive it is to be poor.” Accordingly, in the same paper mentioned above, we factored in what we call wealth-attained advantage. We biased the coin flip in favor of the wealthier individual by an amount proportional to a new parameter, ζ (or “zeta”), times the wealth difference divided by the mean wealth. This rather simple refinement, which serves as a proxy for a multitude of biases favoring the wealthy, improved agreement between the model and the upper tail of actual wealth distributions.
The inclusion of wealth-related bias also yields—and gives a precise mathematical definition to—the phenomenon of partial oligarchy. Whenever the influence of wealth-attained advantage exceeds that of redistribution (more precisely, whenever ζ exceeds χ), a vanishingly small fraction of people will possess a finite fraction, 1 − χ/ζ, of societal wealth. The onset of partial oligarchy is in fact a phase transition for another model of economic transactions, as first described in 2000 by physicists Jean-Philippe Bouchaud, now at École Polytechnique, and Marc Mézard of the École Normale Supérieure. In our model, when ζ is less than χ, the system has only one stable state with no oligarchy; when ζ exceeds χ, a new, oligarchical state appears and becomes the stable state [see graphic above]. The two-parameter (χ and ζ) extended yard sale model thus obtained can match empirical data on U.S. and European wealth distribution between 1989 and 2016 to within 1 to 2 percent.
Such a phase transition may have played a crucial role in the condensation of wealth following the breakup of the Soviet Union in 1991. The imposition of what was called shock therapy economics on the former states of the U.S.S.R. resulted in a dramatic decrease of wealth redistribution (that is, decreasing χ) by their governments and a concomitant jump in wealth-attained advantage (increasing ζ) from the combined effects of sudden privatization and deregulation. The resulting decrease of the “temperature” χ/ζ threw the countries into a wealth-condensed state, so that formerly communist countries became partial oligarchies almost overnight. To the present day at least 10 of the 15 former Soviet republics can be accurately described as oligarchies.
As a third refinement, in 2019 we included negative wealth—one of the more disturbing aspects of modern economies—in our model. In 2016, for example, approximately 10.5 percent of the U.S. population was in net debt because of mortgages, student loans and other factors. So we introduced a third parameter, κ (or “kappa”), which shifts the wealth distribution downward, thereby accounting for negative wealth. We supposed that the least wealth the poorest agent could have at any time was –S, where S equals κ times the mean wealth. Prior to each transaction, we loaned wealth S to both agents so that each had positive wealth. They then transacted according to the extended yard sale model, described earlier, after which they both repaid their debt of S.
The three-parameter (χ, ζ, κ) model thus obtained, called the affine wealth model, can match empirical data on U.S. wealth distribution to less than a sixth of a percent over a span of three decades. (In mathematics, the word “affine” describes something that scales multiplicatively and translates additively. In this case, some features of the model, such as the value of Δω, scale multiplicatively with the wealth of the agent, whereas other features, such as the addition or subtraction of S, are additive translations or displacements in “wealth space.”) Agreement with European wealth-distribution data for 2010 is typically better than a third to a half of a percent [see box below].
To obtain these comparisons with actual data, we had to solve the “inverse problem.” That is, given the empirical wealth distribution, we had to find the values of (χ, ζ, κ) at which the results of our model most closely matched it. As just one example, the 2016 U.S. household wealth distribution is best described as having χ = 0.036, ζ = 0.050 and κ = 0.058. The affine wealth model has been applied to empirical data from many countries and epochs. To the best of our knowledge, it describes wealth-distribution data more accurately than any other existing model.
TRICKLE UP
We find it noteworthy that the best-fitting model for empirical wealth distribution discovered so far is one that would be completely unstable without redistribution rather than one based on a supposed equilibrium of market forces. In fact, these mathematical models demonstrate that far from wealth trickling down to the poor, the natural inclination of wealth is to flow upward, so that the “natural” wealth distribution in a free-market economy is one of complete oligarchy. It is only redistribution that sets limits on inequality.
The mathematical models also call attention to the enormous extent to which wealth distribution is caused by symmetry breaking, chance and early advantage (from, for example, inheritance). And the presence of symmetry breaking puts paid to arguments for the justness of wealth inequality that appeal to “voluntariness”—the notion that individuals bear all responsibility for their economic outcomes simply because they enter into transactions voluntarily—or to the idea that wealth accumulation must be the result of cleverness and industriousness. It is true that an individual’s location on the wealth spectrum correlates to some extent with such attributes, but the overall shape of that spectrum can be explained to better than 0.33 percent by a statistical model that completely ignores them. Luck plays a much more important role than it is usually accorded, so that the virtue commonly attributed to wealth in modern society—and, likewise, the stigma attributed to poverty—is completely unjustified.
Moreover, only a carefully designed mechanism for redistribution can compensate for the natural tendency of wealth to flow from the poor to the rich in a market economy. Redistribution is often confused with taxes, but the two concepts ought to be kept quite separate. Taxes flow from people to their governments to finance those governments’ activities. Redistribution, in contrast, may be implemented by governments, but it is best thought of as a flow of wealth from people to people to compensate for the unfairness inherent in market economics. In a flat redistribution scheme, all those possessing wealth below the mean would receive net funds, whereas those above the mean would pay. And precisely because current levels of inequality are so extreme, far more people would receive than would pay.
Given how complicated real economies are, we find it gratifying that a simple analytical approach developed by physicists and mathematicians describes the actual wealth distributions of multiple nations with unprecedented precision and accuracy. Also rather curious is that these distributions display subtle but key features of complex physical systems. Most important, however, the fact that a sketch of the free market as simple and plausible as the affine wealth model gives rise to economies that are anything but free and fair should be both a cause for alarm and a call for action.